Manufacturing Scale-Up: From Reporting Chaos to Real-Time Visibility
After a successful 14-day Sprint gave leadership its first trustworthy inventory dashboard, they asked Ironhide to scale it: live production tracking, finance alignment, and weekly leadership summaries that everyone could actually use.
What started as “can we see inventory?” became “we can run the week from one screen.”
14 days
Initial Sprint to stand up a clean inventory dashboard
4–8 weeks
Typical Expansion window for production + finance
Every Monday
Leadership snapshot & action items auto-delivered
What the Sprint solved
In the Sprint, we consolidated five years of spreadsheets into a single, governed dataset. The result: a trustworthy inventory dashboard with accurate on-hand, aging, and stockout risk — refreshed automatically.
🧹 One source of truth for item, location, and cost
⏱️ Hours of manual reporting reduced to minutes
👀 Clear visibility into “what’s stuck” and “what’s selling”
Why they expanded
Leadership wanted the same confidence beyond inventory: live production status, schedule adherence, and a weekly summary that didn’t require a meeting to understand.
⚙️ Connect their production & accounting system for live updates
💵 Align sales and finance on the same revenue & margin math
📬 Deliver a no-nonsense leadership summary, every Monday morning
How we built it
We extended the model to include production orders and shipments, standardized the math everyone argues about, and designed a leadership dashboard suite that flows from “what happened” → “what’s off plan” → “what we’ll do next.” Pilot testing ensured managers could use it in real meetings before we rolled it out company-wide.
✅ Live production feed integrated with reconciliation checks
✅ Shared metric definitions across Sales, Ops, and Finance
✅ Leadership dashboards with simple filters and plain-English callouts
✅ Weekly email summary + exception alerts for out-of-range metrics
Visual Showcase
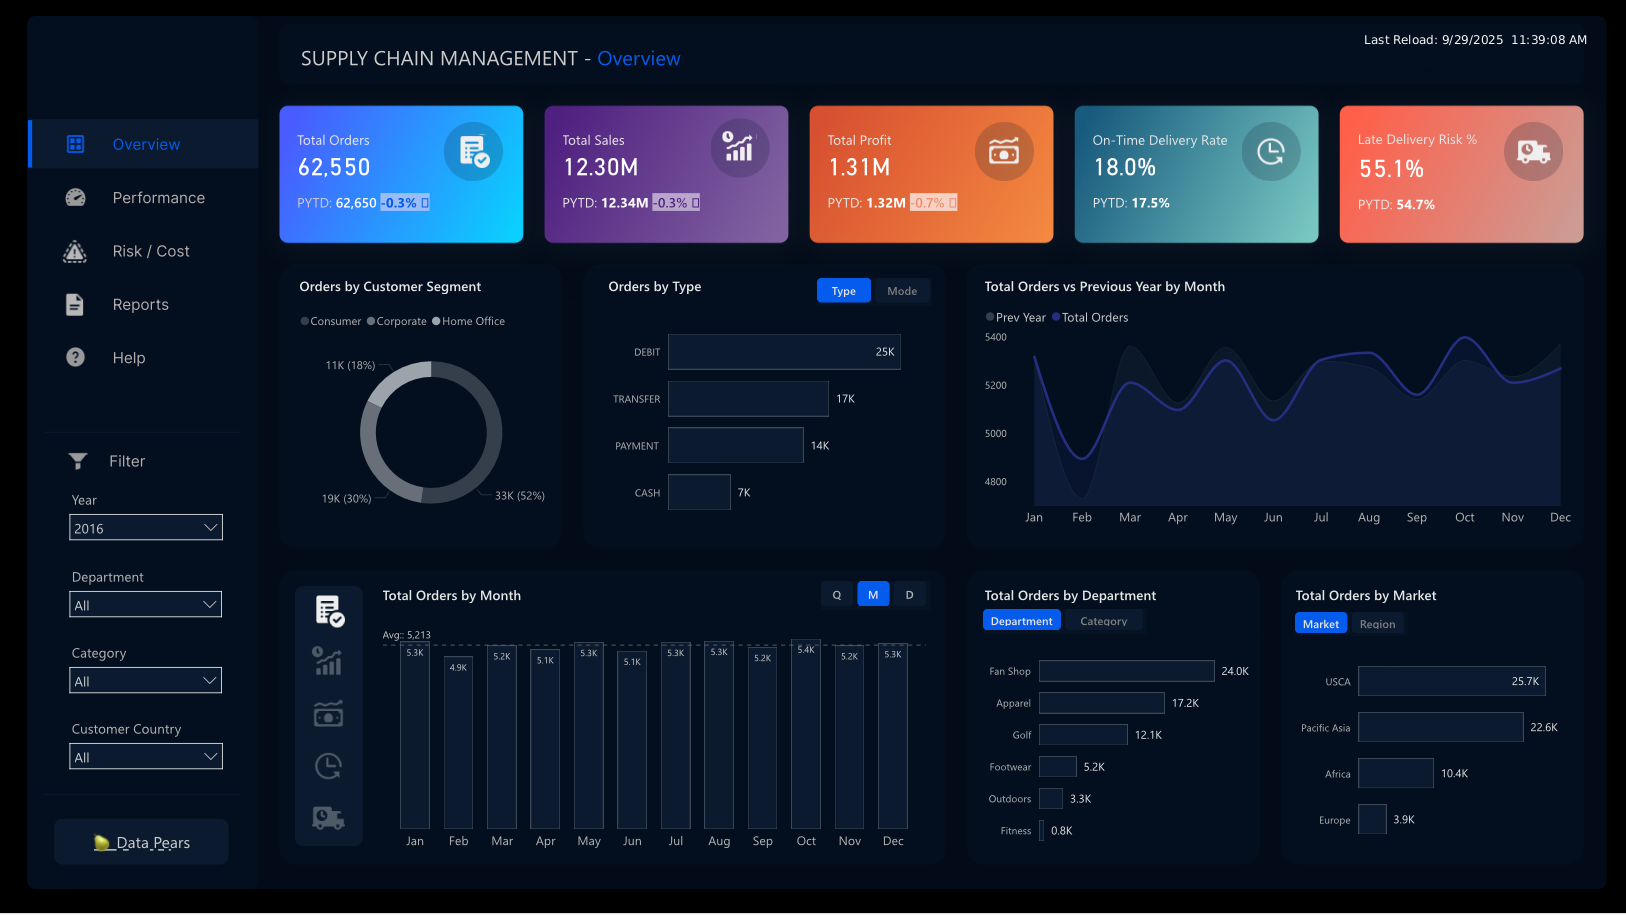
Representative frames from the Expansion — a real dashboard export plus on-brand visuals that mirror how the system works day-to-day.
Production & fulfillment — the weekly view leaders actually use.
Slide 1 of 4
What changed
⏱️ Weekly ops review cut to a focused 15 minutes
🧭 Fewer debates — one agreed set of metrics across teams
🔔 Exceptions caught automatically; managers act the same day
📈 Leadership sees trend, cause, and action on one screen
Tools — and the role each one played
Power BI (leadership dashboards)
Interactive pages for revenue, margin, production status, and exceptions. Simple filters and plain-English callouts keep meetings on track.
SQL (data shaping & checks)
Combined production orders, shipments, and sales into a clean model. Reconciliation queries verify that totals match the source systems before anything ships to execs.
Production & Accounting System Connector
Streams order progress and financial postings into the model so both operations and finance look at the same numbers.
Email Subscriptions
Delivers a one-page Monday snapshot to leaders. No logins required — highlights what changed and where attention is needed.
Data Alerts
Notifies managers when a metric goes out of range (missed schedule, margin dip, backlog spike) so action happens the same day.
OneDrive / Shared Workspace
Versioned storage and shared access for dataset files and exports; keeps refreshes reliable and collaboration simple.