Regional HVAC Services: Reliable Dashboards, Zero Drama
After their Sprint delivered job-level reporting that finally matched accounting, this HVAC company joined an Ironhide Care Plan to keep their Power BI system healthy, refreshed, and steadily improving every month.
No emergencies. No surprises. Just dashboards that quietly work.
≤1 day
Typical response to requests
~99%
Refresh reliability over 90 days
Monthly
Enhancements shipped on cadence
Where we started
Their Sprint tackled the chaos — inconsistent margins, mismatched job costs, and hours wasted fixing exports. The result: dashboards that showed every job’s margin and technician productivity in real time.
🧮 Job-level profitability aligned with QuickBooks
🚐 Live technician performance tracking
📊 Leadership view that ended the spreadsheet wars
Why a Care Plan
The owner wanted peace of mind — fast help when something breaks, quiet monitoring, and the comfort of knowing their dashboards keep pace as the business grows.
🛡️ Proactive refresh monitoring and weekly checks
🧰 A simple queue for tweaks and new KPIs
📬 Monthly “what changed” summary with screenshots
How we run it
Ironhide monitors refreshes, data quality, and key logic so the team doesn’t have to. When new needs come up, requests drop into a named queue — most done in under four hours. Every month, they get a short summary of what improved, what’s fixed, and what’s next.
✅ Power BI refreshes tracked automatically
✅ Outlier alerts when metrics drift or fail
✅ Visual and formula updates logged transparently
✅ Monthly notes with before/after views
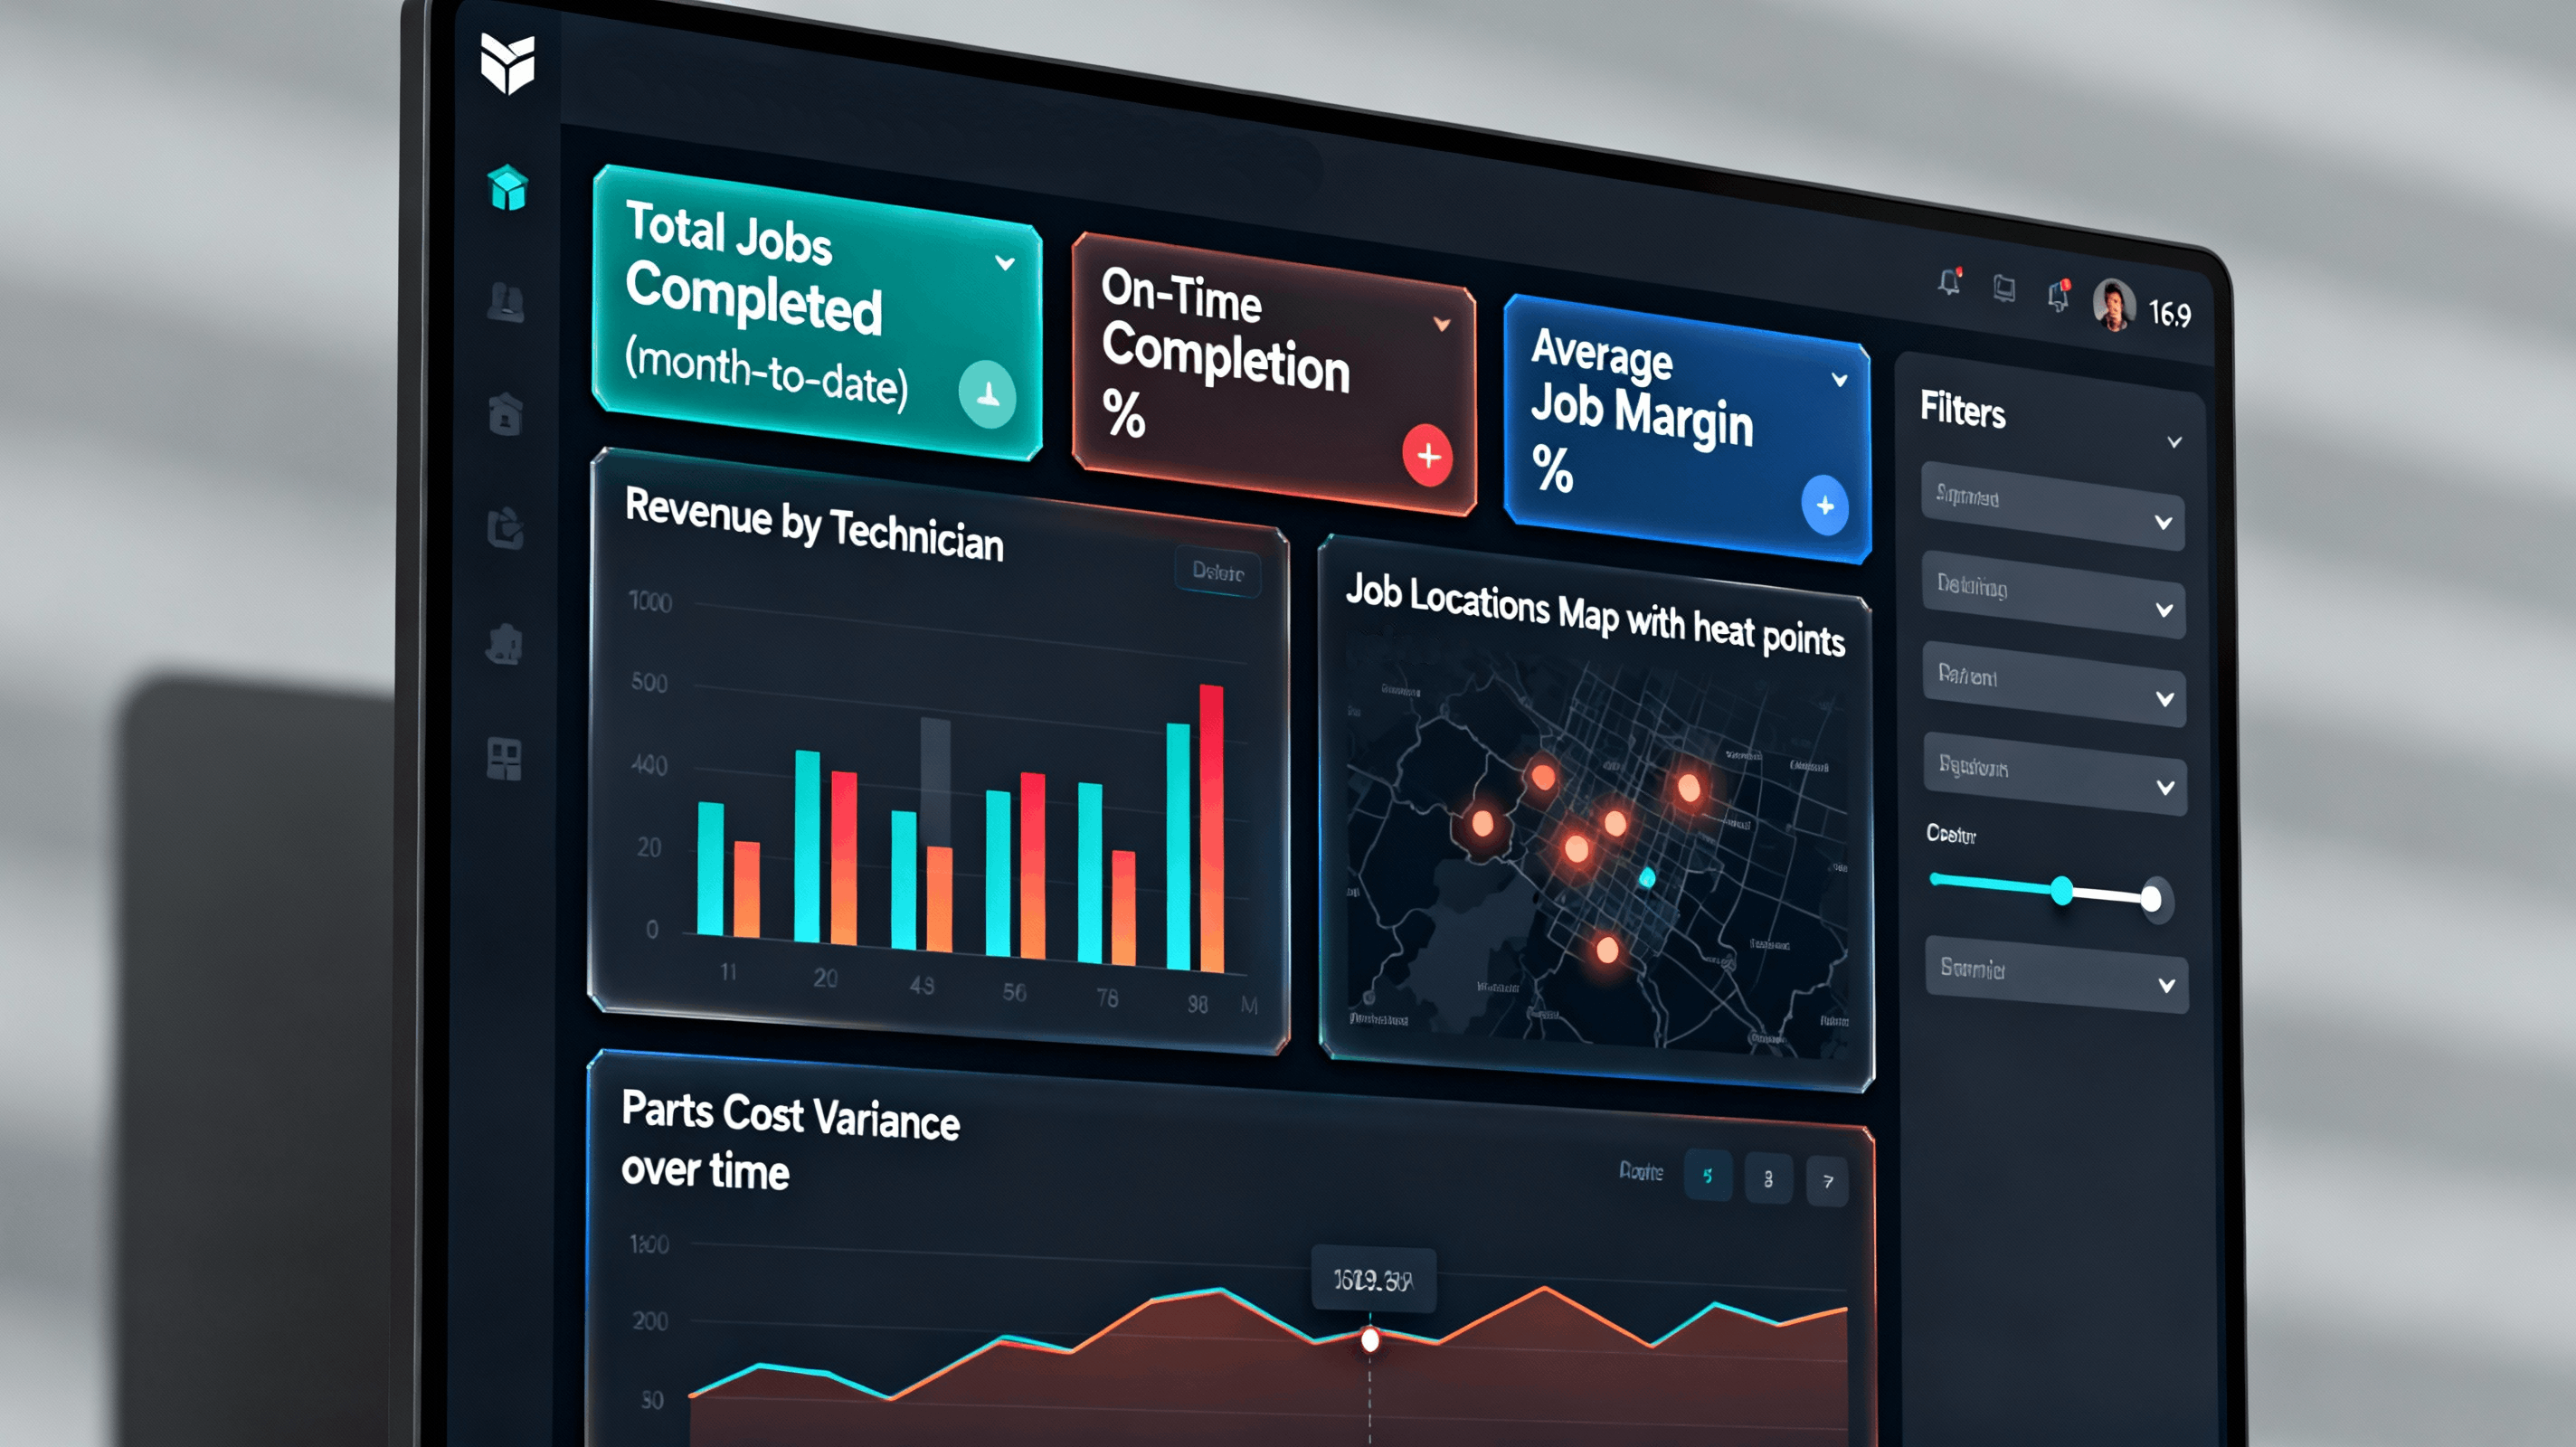
Visual Showcase
Five frames that capture how this Care Plan works in practice — from monitoring to improvements, leadership views, and request flow.
HVAC performance dashboard — profit, timing, and workload in one view.
Slide 1 of 5
What changed
⏱️ Reports stopped breaking mid-week
🧭 Leadership meetings stayed focused on decisions, not fixes
🔔 Outliers caught and handled before they hit the team
📈 Dashboards quietly improved every month
Tools — and the role each one played
Power BI (dashboards we maintain)
Job-level profit, technician performance, and scheduling views. We keep calculations and visuals consistent as new requests come in.
Power Automate (refresh + alerts)
Monitors dataset refreshes and sends pings if something fails so we can jump in quickly.
SQL / Data Checks
Reconciliation queries that make sure totals match source systems; guards against new fields breaking established math.
Email Subscriptions
Delivers a short weekly snapshot to leaders — no login required — highlighting what changed and any exceptions.
OneDrive / Shared Workspace
Versioned files and shared locations for dataset artifacts and exports; keeps collaboration tidy and refreshes reliable.
Monthly Notes (change log)
A lightweight report with before/after screenshots so stakeholders see exactly what improved and why.
Want your dashboards to just work — and get better every month?